LEfSe
Description
Tool: https://huttenhower.sph.harvard.edu/galaxy/
Publication: Segata et. al 2011
LEfSe (Linear discriminant analysis effect size) is a tool developed by the Huttenhower group to find biomarkers between 2 or more groups using relative abundances. The tool is hosted on a Galaxy web application, so there is no installation or downloads. This tutorial will only cover the basics for using LEfSe. The link above can give more detailed information about the LEfSe-Galaxy application.
LEfSe uses a table of relative abundances which also includes sample identifiers and group meta data. QIIME typically keeps abundance data and meta data in separate files, so to generate a file compatible with LEfSe, we need to prepare the data in a few steps.
The input table that is required for analysis must have:
- Sample Identifiers, which is normally #SampleID within the mapping file
- Class variable. This is the most important variable and will be used to compare the two or more groups in your sample meta data.
- Subclass variable. This variable is optional and is only needed if your question and data are setup for use with it. See the paper/link for more information.
Preparing QIIME data for LEfSe
The first step is to convert your OTU table into relative abundances. The QIIME command sumarize_taxa.py will convert the table, in addition to adding sample meta data.
The output folder will have many different files which correspond to the different levels of phylogeny. You will have to choose at what level you would like to analyze the data. In this work flow we will choose level 6 (Genus).
Convert to relative abundance
# Start QIIME
macqiime

# Convert to relative abundances
summarize_taxa.py \
-i otu_table.biom \
-o summarize_taxa_L6 \
-m mapping_file.txt \
--delimiter '|'
Remove unnecessary meta data from table
The output file includes all the relative taxa abundance information for each of the samples, along with all of the mapping file data. LEfSe needs at most, two column of meta data and one column of sample identifiers, so you must delete all the meta data columns which you are not interested in analyzing. Additionally it is best to delete the '#' character in front of the #SampleID column name in your table.
Analyzing QIIME data with LEfSe
Once the table has been created and there are a maximum of 3 columns (can be 2) plus all the taxaonomic names and abundances, you are ready for analysis. Go to https://huttenhower.sph.harvard.edu/galaxy/ to access the web application.
The first step is to upload the table we just created in the previous steps. On the left hand side of Galaxy, there is a Get data option along with a Upload data selection. Choose File upload and select the LEfSe input table.
A. Format data
Next we need to format the table using LEfSe's internal processing functions. In this step we also need to specify which columns are our class/subclass and sample ID.
a. For the first option, be sure the input name is the same file you would like to perform the analysis on.
b. Next under Select whether the vectors (features and meta-data information) are listed in rows or columns:, you must have Columns as the selection.
c. For the next 3 selections, you must choose which colum names correspond to the Class/Subclass and SampleID.If you only have Class and SampleID, you can leave Subclass as 'no subclass'
B. Run LEfSe
Once the correction selection have been made, you can go to the next step on the left-hand side called LDA Effect Size (LEfSe), which will allow you to customize the p-values and effect size cutoffs for any significant taxa.
Note on interpretation of results: LEfSe finds taxa which describe a particular group the most, so if you see any taxa colored according to a variable (e.g like Control or Treatment), you can interpret this as that taxa being significantly increased in abundance compared to the other group
C/D. Plotting data
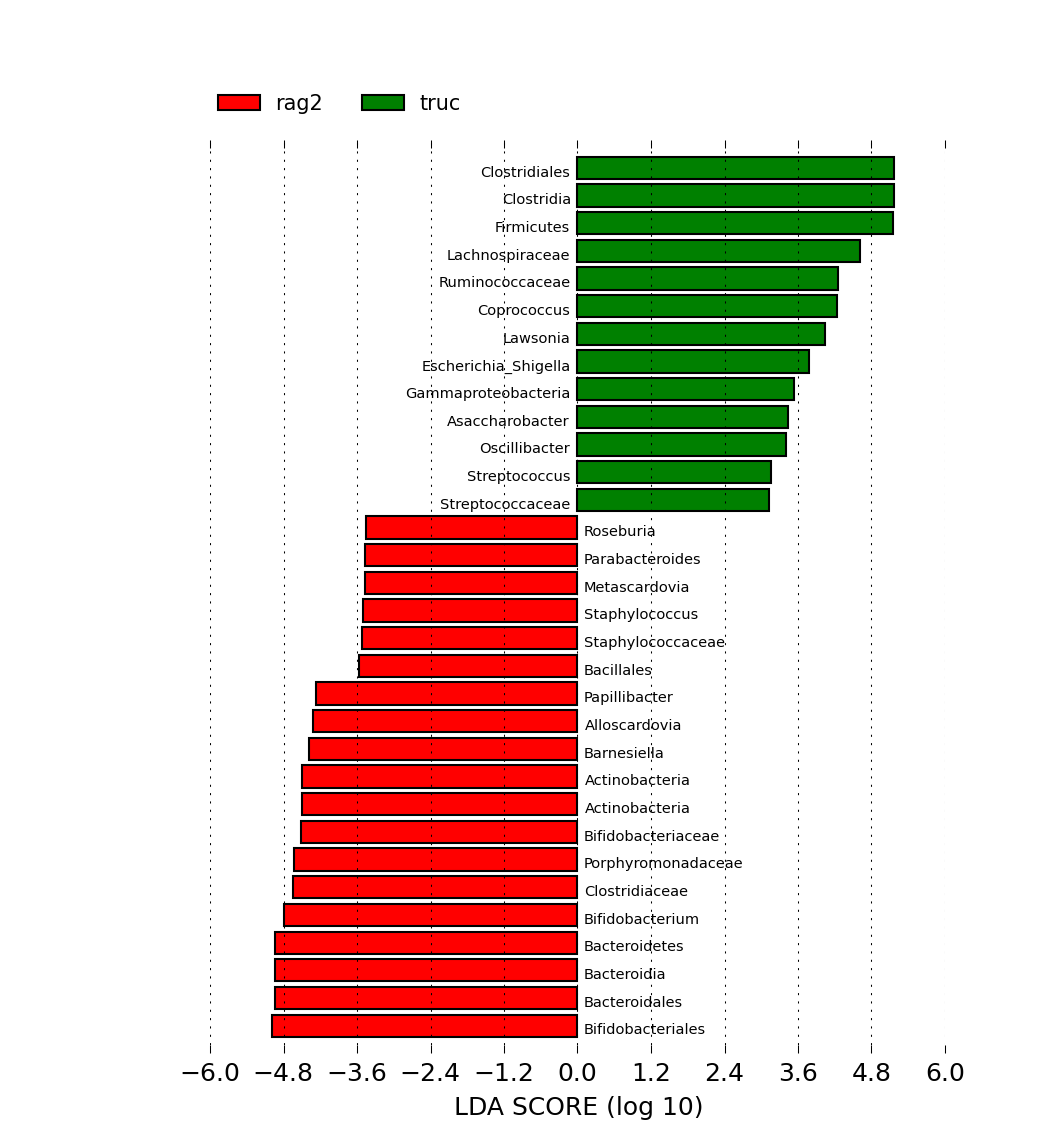
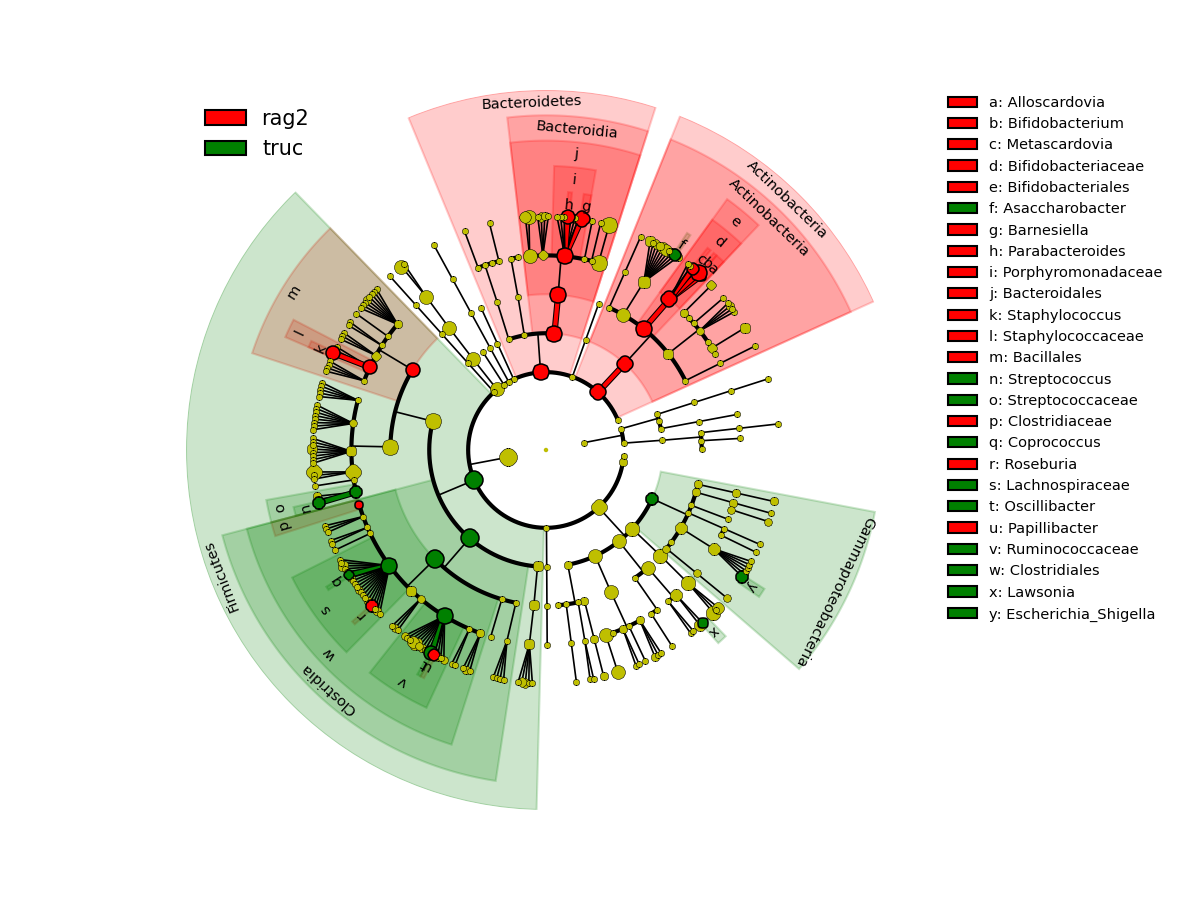
After running LEfSe and generating significant taxa, you can use the 2 plotting features, C) Plot LEfSe Results and D) Plot Cladogram .
This plot generates a graph that has bars which represent the effect size (LDA) for a particular taxa in a certain group. The length of the bar represents a log10 transformed LDA score. The colors represent which group that taxa was found to be more abundant compared to the other group. Even though the LDA score of the rag2(red) is negative, that is due to the order of the numerator and denominator when calculating the effect size. This order is determined by alphabetical order, so we can always use the absolute values of the effect size to get an interpretation of the scale of the difference between 2 groups for a certain taxa.
The second plot shows the results in the form of a cladogram, which is a visual way of representing significance and phylogeny. The color represent which branch of the phylogenetic tree more significantly represents a certain group. In this case Actinobacteria and Bacteroidetes are more abundant in the rag2 group and Firmicutes are more significantly abundant in the truc group
Using the Koeken tool
https://github.com/twbattaglia/koeken
Description
Another tools has been developed to use LEfSe directly with QIIME data for rapid analysis. It was built so that users can analyze their 16s rRNA data with LEfSe without having to manually change the metadata information and upload the data to Galaxy. It was also built so that it analyzed the data with LEfSe over many time points. This drastically reduced the amount of time for subsetting and formatting the data before analyzing.
Installation
# Start macqiime
macqiime

# Install Koeken
pip install https://github.com/twbattaglia/koeken/zipball/master
Usage
Here is a simple usage of Koeken. You need to specify a class variable and also a split variable that corresponds to the meta data that you would like to break the table into. Typically this variable corresponds to the Time aspect of your data so that you can see what the biomarker taxa are for each individual time points.
koeken.py \
--input otu_table.biom \
--output koeken_output \
--map mapping_file.txt \
--level 6 \
--class Treatment \
--split Day \
--clade
Output
Koeken generates many files as it iterates over each time point. These files can be used directly on the LEfSe-Galaxy web application if needed. You can upload the files within the run_lefse folder and select lefse_res as the file type. The web application should recognize its format and allow you to plot the cladogram and barplot.
Note: If you include the --clade option, the cladograms will be generated for each of the analyses.
Breakdown of the output files/folders:
── koeken_output/
  └── summarize_taxa_L#/ (Summarize taxa output files)
  └── lefse_output/
      └── format_lefse/ (Formatted LEfSe files)
      ├── run_lefse/ (Results from running analysis files)
         └── clade/ (PDF's of analysis cladograms)
More QIIME/LEfSe related tools
Here are a list of other great QIIME/LEfSe tools for easier processing and analyses. (TODO)